
Why Summary Statistics Can Lead to Expensive Business Mistakes
Learn why relying on a single average can hide the truth behind your data and lead to poor business decisions.

Why You Should Plot Your Data Before Calculating Statistics
Stop trusting single summary numbers. Learn why scatter plots are the essential first step for any data analysis or forecast.

Visualizing Word Vectors: How AI Models Map Language Meaning
Discover how word vectors use geometry to represent language meaning and how AI models learn to cluster related concepts in a high dimensional cloud.

Understanding p-values and Why They Are Not What You Think
Stop misinterpreting your data. Learn what a p-value actually means and how to avoid the most common statistical mistakes.

Understanding the Difference Between Correlation and Causation in Data Analysis
Learn why a rise in metrics doesn't always mean your feature worked and how to identify real causal relationships in your data.
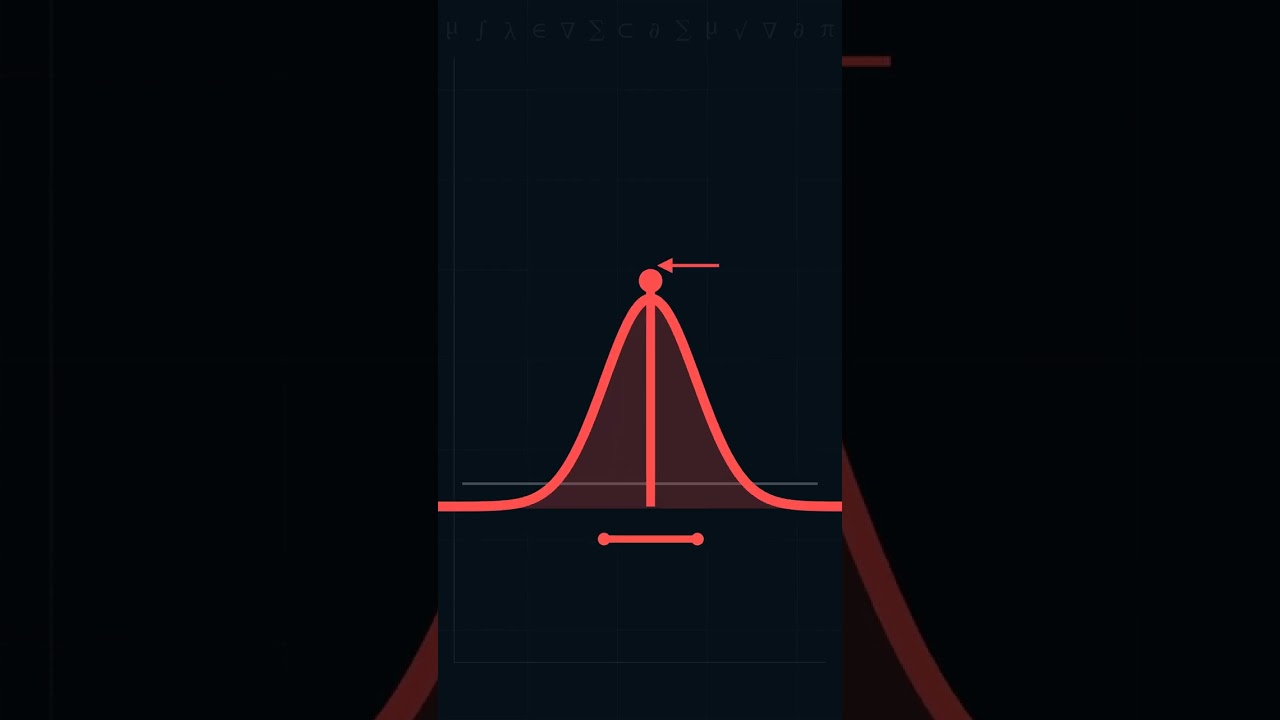
Why Outlier Trimming Can Destroy Your Data Accuracy and Forecasts
Deleting extreme data points might make your charts look better but it ruins your accuracy. Learn why outlier trimming is a dangerous statistical habit.